
One of the central pillars of the argument for a Conservative government in Downing Street is fiscal responsibility; the idea is that the Labour party would run up debt with unrestrained spending and the Conservatives then have to come in and clean up the mess. With seven years in government, almost 10 years since the 2007/08 economic crash and ‘credit crunch’ began, and the strong economic record that the Conservatives are defending vigorously, we decided to take a look at how the economy has performed under their tenure.
GDP
2007: £1,757,521 million
2008: £1,749,216 million
2010: £1,704,364 million
2015: £1,888,737 million
2016: £1,922,626 million
GDP growth has been strong and whilst that is partially exaggerated due to the 2010 low-point, the Conservatives have managed to keep the economy growing throughout their seven years. Brexit has somewhat disrupted this growth, the growth forecast for 2017 has been downgraded by the IMF from 2.0% to 1.7%, as uncertainty over Britain’s future continues. Brexit initially led to stronger than expected economic activity at the end of 2016, but a slow three months at the start of the year have turned these predictions around.
Deficit
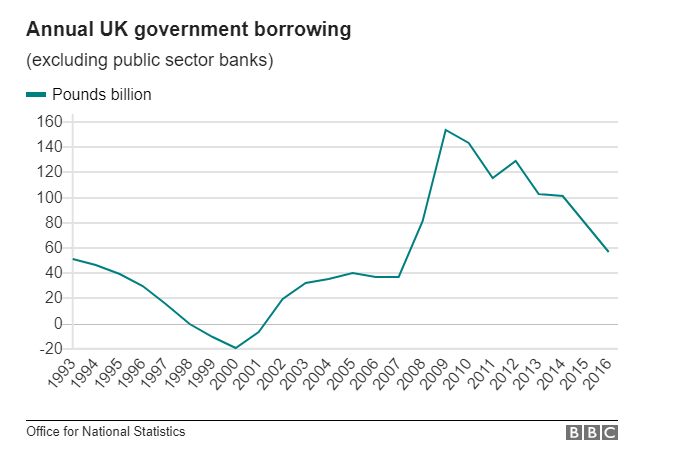
Source – http://www.bbc.co.uk/news/business-39897498
2007: £36.97 billion
2008: £81.776 billion
2010: £143.625 billion
2015: £79.017 billion
2016: £57.096 billion
National Debt
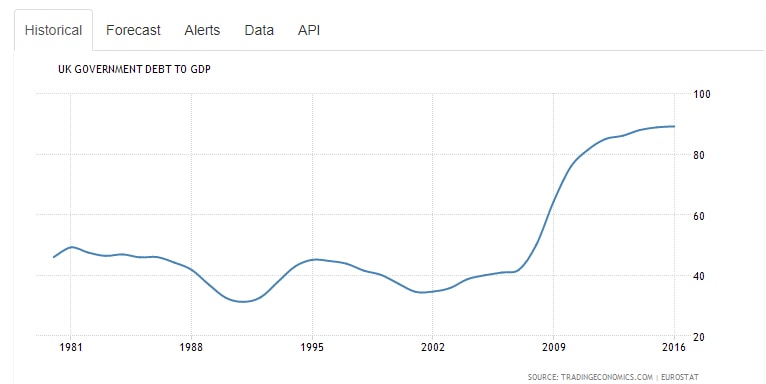
2007: £532.1 billion (34.5% of GDP)
2008: £626.9 billion (40.4% of GDP)
2010: £1,067.2 billion (67.3% of GDP)
2015: £1,538.1 billion (83.6% of GDP)
2017: £1,773.3 billion (88% of GDP)
Source – https://www.ons.gov.uk/economy/governmentpublicsectorandtaxes/publicsectorfinance/timeseries/hf6w/pusf
https://www.ons.gov.uk/economy/governmentpublicsectorandtaxes/publicsectorfinance/timeseries/hf6x/pusf
Once we begin to look at both the government deficit and the debt, both in monetary terms and as a percentage of GDP (in order to assess the debt relative to the size of the UK economy), we can begin to see the true record of Conservative management of the economy. The UK debt is more than triple what it was in 2007, although it is slightly less than triple as a percentage of GDP, so claims that the Conservatives have tripled the debt are slightly exaggerated. The debt is now estimated at 88% of GDP, the highest it has been in decades. This could be attributed to the borrowing required to ride out the recession, but since 2010, the Conservatives have added over £700 billion to the UK debt, taking it from 67.3% of GDP in 2010 to 88% of GDP in 2017. This may have come in the wake of arguably the worst economic depression since the 1930s, but austerity was framed at reigning in the public purse, and cutting government spending to “within our means”.
The government has done some good work in reducing the deficit, taking it from £143 billion in 2010, to £57 billion for 2016, but this is considerably higher than where it was at in 2007 (£37 billion). As a percentage of GDP the debt has fallen but given the social and economic cost of austerity for millions of families, this does seem like a poor economic record. Has seven years of austerity truly been worth the financial reward that has been reaped from this tightening of our belts?
Corporate Profits as Percentage of Tax Revenue
2007: 9.46%
2008: 10%
2010: 8.74%
2015: 7.55%
Sources – https://data.oecd.org/tax/tax-on-corporate-profits.htm
https://www.ifs.org.uk/publications/9207
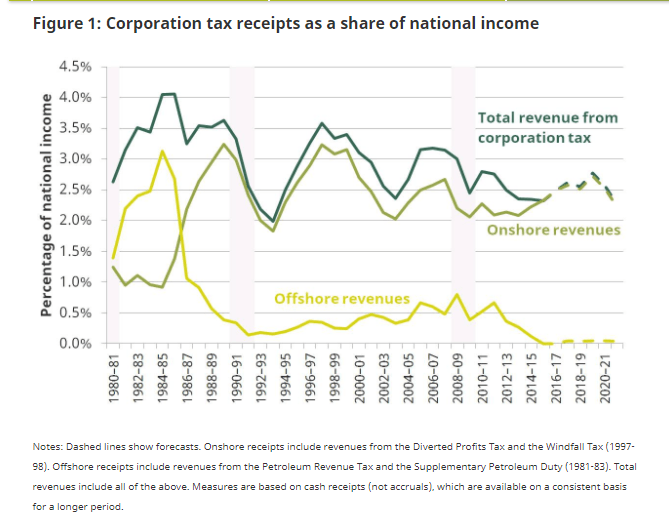
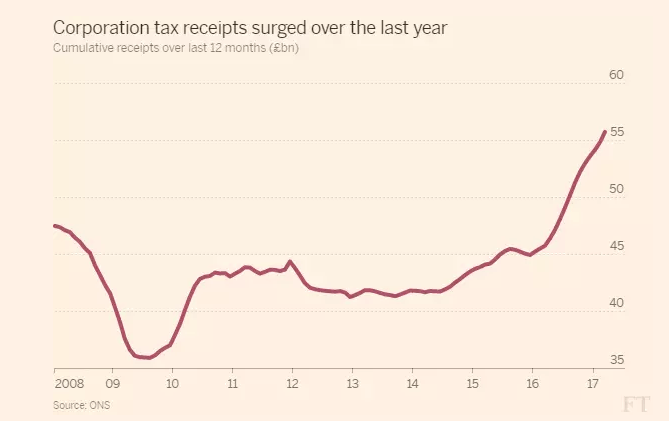
Whilst the amount of corporate tax revenue that has been raised has increased since the 09/10 lull (caused by the financial crash) as corporation tax has been pushed down and more and more companies have decided to headquarter themselves in Britain, corporate tax revenue as a percentage of tax revenue and national income has remained fairly contant over the past 10 years. It has declined as a share of national income since the 80s and 90s and off-shore revenues have fallen to zero. The IFS has estimated that the cuts to corporation tax since 2010 have cost the country some $16 billion a year in tax revenue, although that has been offset by the number of businesses setting up headquarters in the UK since the Conservatives came to power and declared Britain “open for business”.
Unemployment Rate
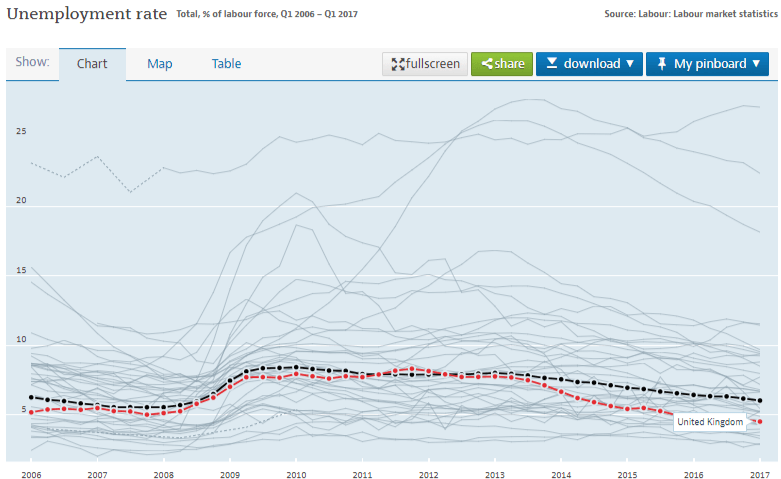
2007: 5.25%
2008: 5.8%
2010: 7.62%
2015: 5.28%
2017: 4.52%
The unemployment rate has steadily declined over the past 7 years from its 2010 peak and has just dropped below 5%, a solid record if these were reliable well-paid jobs. However, these statistics don’t give the real picture of a low-wage economy based on part-time work and zero-hour contracts; the gig economy is quickly becoming a major source of income for more and more people.
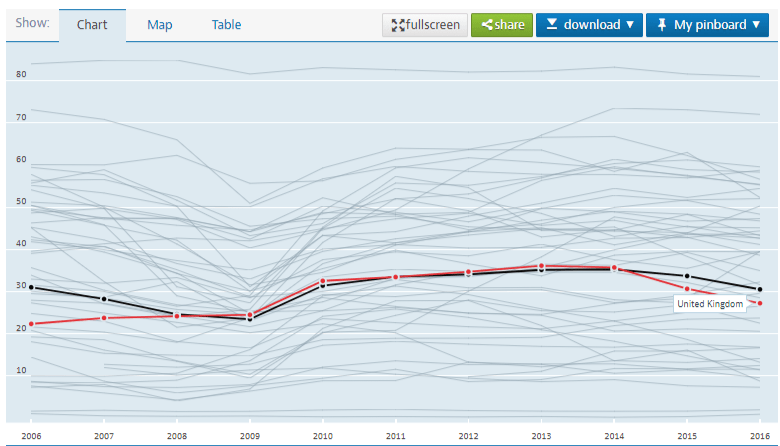
The rise of automation may mean that in the future all work is part-time to an extent, as the number of full time jobs is likely to decline as technology improves. However, this sort of economy would rely upon a robust welfare state, something that the Conservatives are slowly dismantling. The other thing that should be concerning for the government, is the extremely high long-term unemployment rate. It is generally considered to be an indicator for a poorly functioning jobs market.
Sterling vs Dollar (£1=)
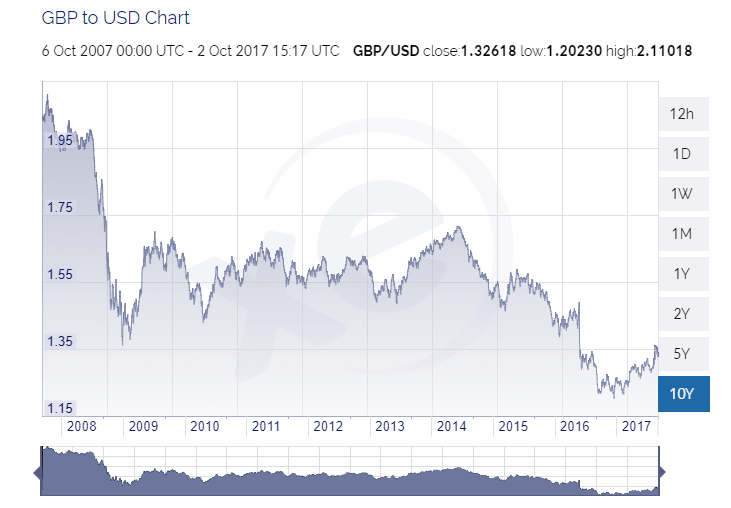
October 2007: 2.11
October 2008: 1.75
October 2010: 1.58
October 2015: 1.51
October 2017: 1.33
http://www.xe.com/currencycharts/?from=GBP&to=USD&view=10Y
Sterling vs Euro (£1=)
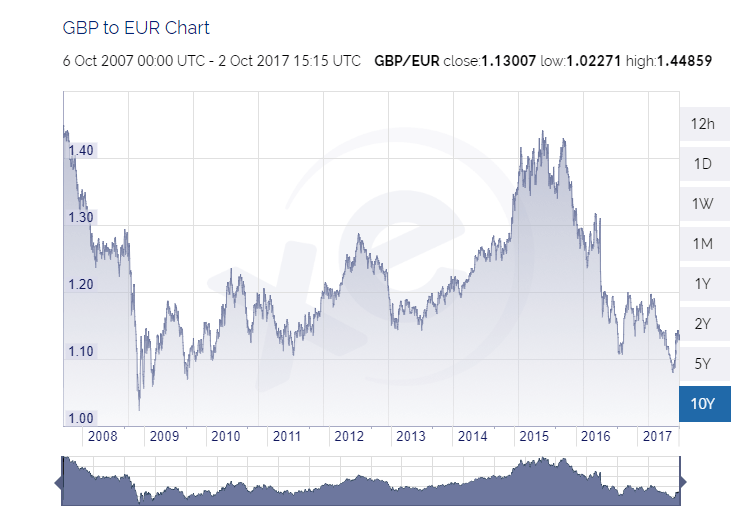
October 2007: 1.44
October 2008: 1.25
October 2010: 1.17
October 2015: 1.35
October 2017: 1.13
Source – http://www.xe.com/currencycharts/?from=GBP&to=EUR&view=10Y
The Pound, after periods of recovery following the 2007/08 crash, did have periods of relative growth against both the Dollar and the Euro. However, the exchange rate with the Euro has been declining since early 2015 and against the Dollar since 2014, trends which have only been accelerated by the economic uncertainty that has come as a result of the Brexit vote and the lack of clarity over future trading relationships inside and outside of Europe.
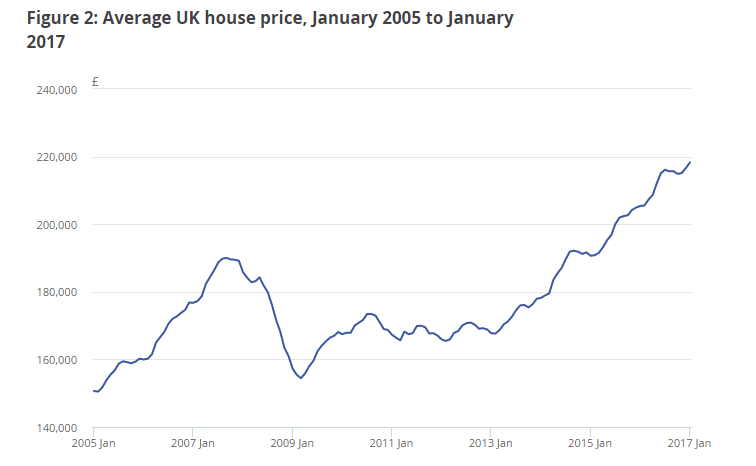
The economy is in a better state than it was 10 years ago, the 2007 financial collapse left Britain struggling to rebuild and it has, well at least the top 1% have. Their incomes returned quickly to pre-crash levels, housing speculation (particualrly in London) has pushed the average house price above where it was 10 years ago, and the economic growth we have seen in GDP has come at the top end of society, not the bottom.
 2
2
Between 2010-2016 homelessness increased by 54% according to Government figures, in January it was revealed that the number of rough sleepers had actually increased 133% since 2010, and in March, Government figures showed an increase of children living in poverty of 100,000 from 2016. The number of people using food banks has also increased by 7% in the last year, according to Trussell Trust’s Foodbank Network, and post-referendum, increased inflation has meant that wages are worth less and less.
The economy that has been built over the last years by the Conservative Party works for those at the top, but not for the majority of people, or even (ironically) the majority of their voters – were it not for the collapse of UKIP after Farage resigned his leadership, they may have found the right wing working class vote swing even further towards UKIP. The strong economic record they talk of is one built from the top down, not the bottom up. Britain has the worst performing economy in the G8 and the EU, so why do the Conservatives still maintain that they have a strong economic record?
If you enjoyed what you read here you can follow us on Facebook, Twitter, and Instagram to keep up to date with everything we are covering, or sign up to our mailing list here! If you want to hear more from us you can check out our podcast, Chatter, or subscribe to us on iTunes here.